Data Analytics & Visualisation with Excel
🎯 Duration: 6 Weeks
📚 Key Takeaways:
- Transform raw data into actionable insights using Power Query and Power Pivot.
- Master DAX formulas for advanced data calculations and performance analysis.
- Create professional, interactive dashboards and reports with cutting-edge visualization techniques.
- Automate tedious tasks using VBA macros, saving time and improving efficiency.
- Gain a solid foundation in Business Intelligence by integrating Excel with Power BI.
- Build reusable Excel templates and forms for streamlined reporting.
💻Who Should Attend?
This course is ideal for beginners with the intention of transitioning into Data Analytics Career. The course is also ideal for professionals in data analysis, finance, business management, and operations who want to elevate their Excel skills. It’s also suitable for individuals preparing to transition into roles requiring expertise in data modelling, visualization, and automation.
🛠 Practical Focus:
This program emphasizes hands-on learning, with real-world examples and a final project to consolidate your knowledge. Sample projects include sales performance dashboards, financial forecasting models, and automated reporting systems.
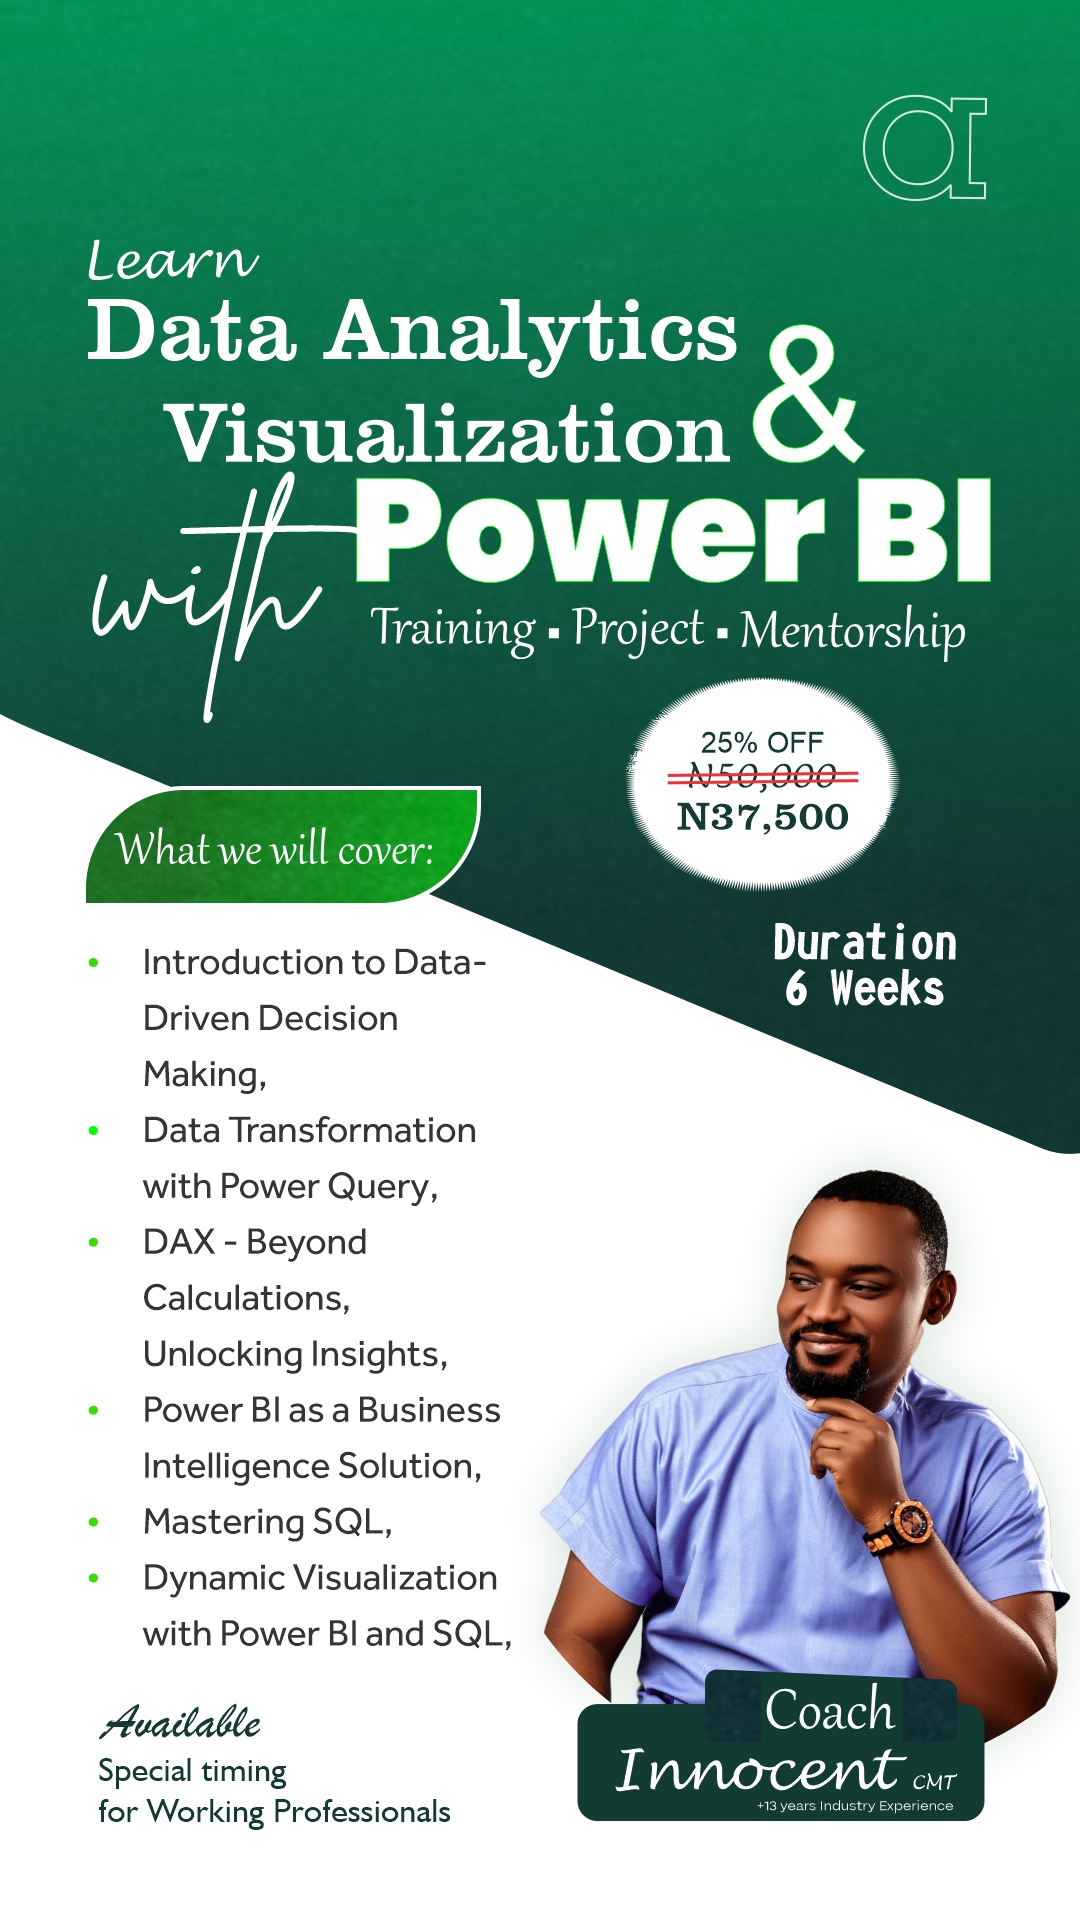
Data Analytics & Visualisation with Power BI
Course Highlights
- Beginner to Advanced Learning Path: Start with the basics of Power BI and progress to advanced techniques like DAX, Time Series Analysis, and SQL integration.
- Hands-On Practice: Work on real-world case studies and practical projects, including customer segmentation, financial analysis, and sales forecasting.
- Advanced DAX & SQL: Master DAX calculations, Time Intelligence functions, and how to integrate SQL queries for real-time analysis.
- Power Query Mastery: Learn data transformation techniques to clean and reshape your data for deeper analysis.
- Effective Data Visualization: Gain expertise in building interactive dashboards and reports that communicate insights clearly.
- Capstone Project: Apply your learning to a comprehensive project, solving a business problem with Power BI from start to finish.
- Industry Insights: Learn from guest speakers and professionals who use Power BI to drive business success.
🎯 Duration: 6 Weeks
This course spans 6 weeks, with each week focusing on key Power BI features and techniques. By the end of the course, you will have the skills needed to confidently analyse and visualize data using Power BI in a business context.
📚 Key Takeaways
- Proficiency in Power BI Desktop for data analysis and visualization.
- Ability to connect and manage various data sources, including databases and APIs.
- Expertise in transforming, cleaning, and modelling data with Power Query.
- Advanced knowledge of DAX for creating powerful calculations and KPIs.
- Skill in designing interactive dashboards and reports that communicate business insights.
- Experience with SQL integration for dynamic data reporting.
- A portfolio-ready Capstone project showcasing your Power BI expertise.
🛠 Practical Focus
This course focuses on real-world applications, ensuring that you not only learn the technical features of Power BI but also how to apply them in solving business challenges. You will be working on hands-on projects that involve actual data, enabling you to understand how Power BI can be used to drive business decisions and improve organizational performance. The curriculum includes case studies from various industries, making it easy to relate to your own professional context.
Data Analytics & Visualisation with Python
-
Course Duration:
- 6 Weeks
-
Key Benefits:
- Learn Python fundamentals for data analysis and visualization.
- Master essential libraries like Pandas, NumPy, and Matplotlib.
- Create static and interactive visualizations with Seaborn and Plotly.
- Analyze and interpret real-world datasets to uncover insights.
- Build portfolio-worthy projects to showcase your skills.
- Gain an understanding of statistical concepts applied through Python.
-
Course Highlights:
- Practical Focus: Hands-on practice with real-world datasets.
- Advanced Visualization Techniques: Learn to craft insightful charts and dashboards.
- Python for Business Insights: Solve industry-relevant problems with data.
- Capstone Project: Apply your skills to a real-world data challenge.
- Industry Experts: Learn from experienced professionals in data analytics.


